Open day on National Science Day
Every year, the Homi Bhabha Centre for Science Education has an Open House on National Science Day (NSD), which falls on February 28, which witnesses over 2000 visitors which include students, teachers, teacher educators, and parents. On these occasions, Design and Technology (D&T) education group also arranges an array of activities aimed at sparking creative problem solving and expression and gives visitors opportunities to think, make and test. Some of the activities we plan also aim at popularising D&T by giving a flavour of working with hands while using their imagination.
National Science Day 2026
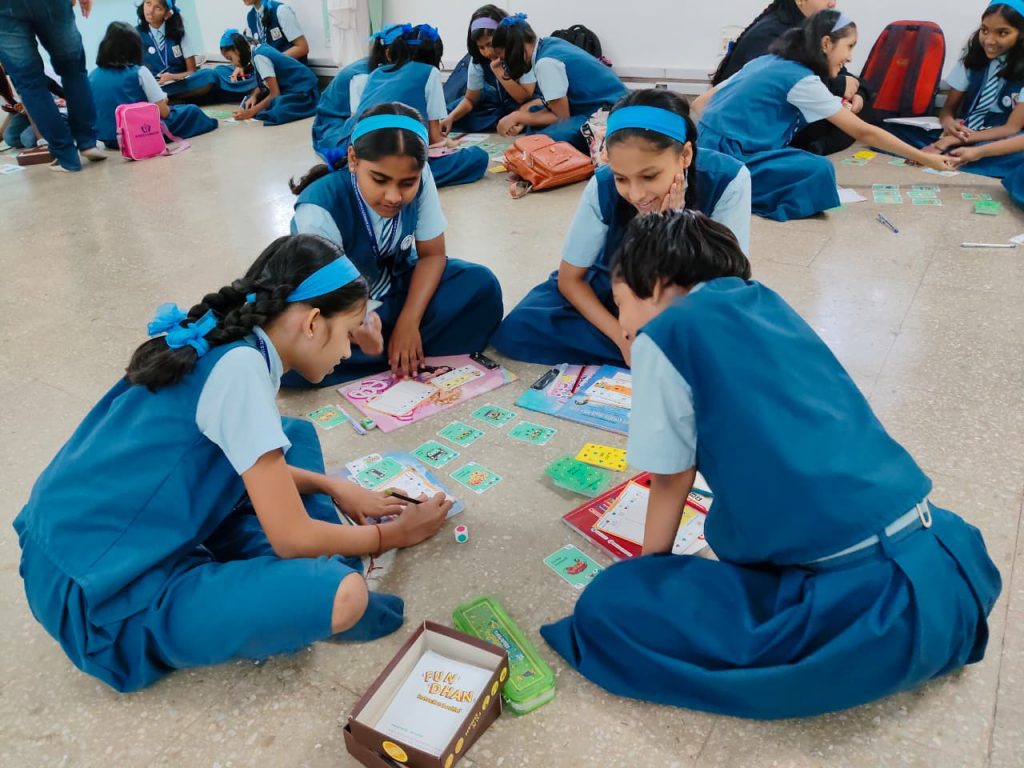
On the occasion of National Science Day, the Homi Bhabha Centre for Science Education hosted an Open Day on 27 February 2026. The campus was visited by around 2100 students, teachers, and parents. Numerous demos, workshops, experiments and sessions were organised, of which the D&T group organised sessions on educational games/activities on financial literacy, waste management and composting. Close to 160 students attended these sessions.
Fundhan
On this day, the D&T group formally launched a new educational game called FunDhan. Through FunDhan, students explored how to track their expenses, maintain budget sheets, make effective decisions about spending and saving, and learnt how everyday choices affect financial planning and goals.
Think Before You Throw
The D&T group implemented an innovative, game-based lesson for visiting students called “Think Before You Throw”, consisting of 3 levels of hands-on activities focused on waste management and composting. Students were introduced to key concepts such as waste segregation, recognising dustbins designated for different types of waste and their symbols, and understanding the various stages of composting. They also participated in hands-on activities that allowed them to experience the challenges of managing waste firsthand, fostering empathy and emphasising the importance of segregation at the source.
National Science Day 2025
On the occasion of National Science Day, the Homi Bhabha Centre for Science Education hosted an Open Day on 28 February 2025. The campus was visited by around 2200 students, teachers, and parents. Numerous demos, workshops, experiments and sessions were organised, of which the D&T group organised sessions on data visualisation and categorisation. Close to 200 students attended these sessions
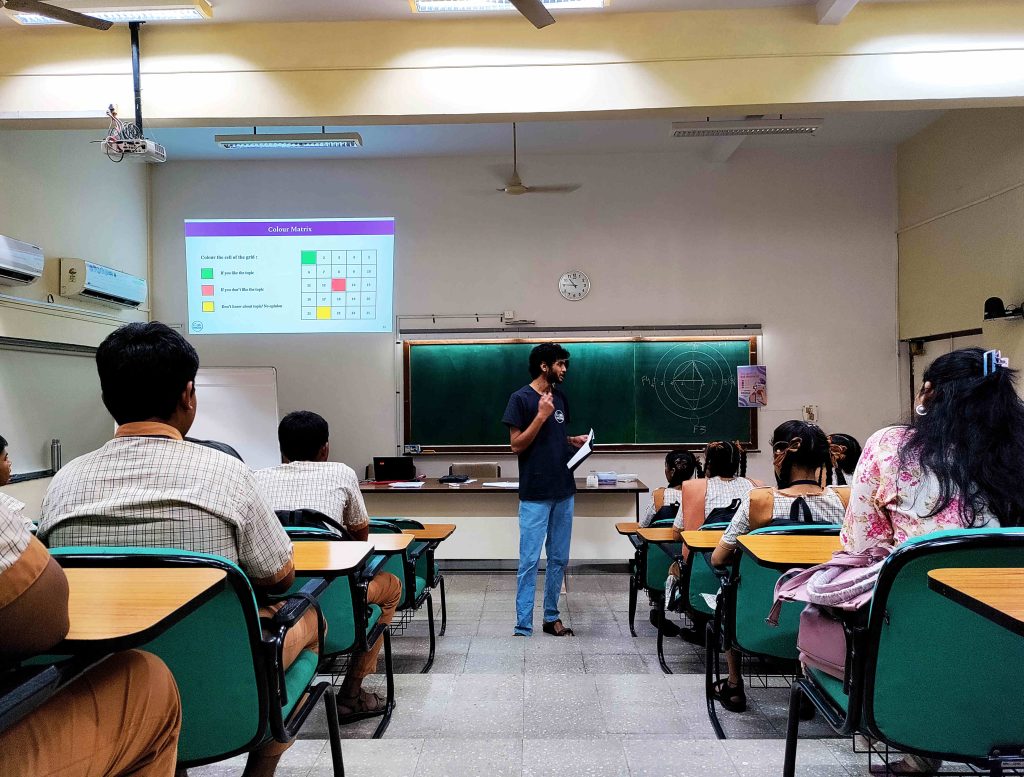
Colour Matrix
A simple and fun activity, designed to showcase to students how data can be collected and represented using a colour scheme. Each student prepared their own data sets and gained a basic insight into how multiple data sets can be analysed and interpreted when placed together. Students from class 6 to 9 took part in this activity.
Recognise And Categorise
Recognise and Categorise was an activity designed to introduce the concept of data categorisation, where students had to come up with creative ways to categorise different items. The activity involved categorising items first in pairs and then in triplets using a Sudoku-inspired grid. Students of class 6 to 9 took part in this activity.
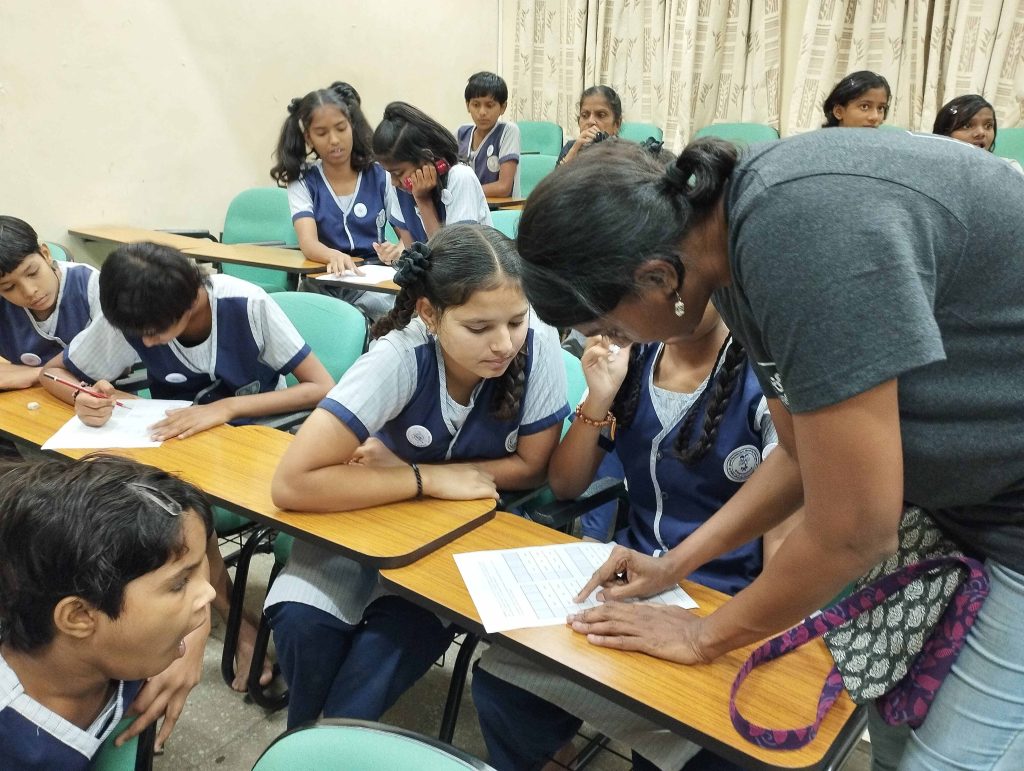
Priority Quest
Priority Quest is an activity which focuses on how data can be presented and analysed effectively, which can help us to make informed decisions. Through worksheets, students represented their data using text, drawings, scaling, and graphing. Students of class 8 and 9 worked individually or in dyads.
National Science Day 2024
On the occasion of National Science Day, the Homi Bhabha Centre for Science Education hosted an Open Day on February 28 and 29, 2024. The campus was visited by around 4,000 students, teachers, and parents. Numerous demos, workshops, experiments and sessions were organised, of which the D&T group organised sessions on educational games and an activity on nature and mathematics (titled Jungle Safari). Close to 150 people attended these sessions.
Educational Games
Funance is an educational game involving strategy, risk and mathematics to sensitise students about financial literacy. The prototype of the game was tested with students of class 7, 8, 9 as well as with B.Ed students. Feedback was collected so that this may be used to further improve the game.

Trace the Waste, an educational game that will soon be available for purchase, is aimed at sensitising players about waste management and the repercussions of refusing, resuing and recycling waste. Students in grade 8 and above played this game in groups of four or in pairs.

Jungle Safari
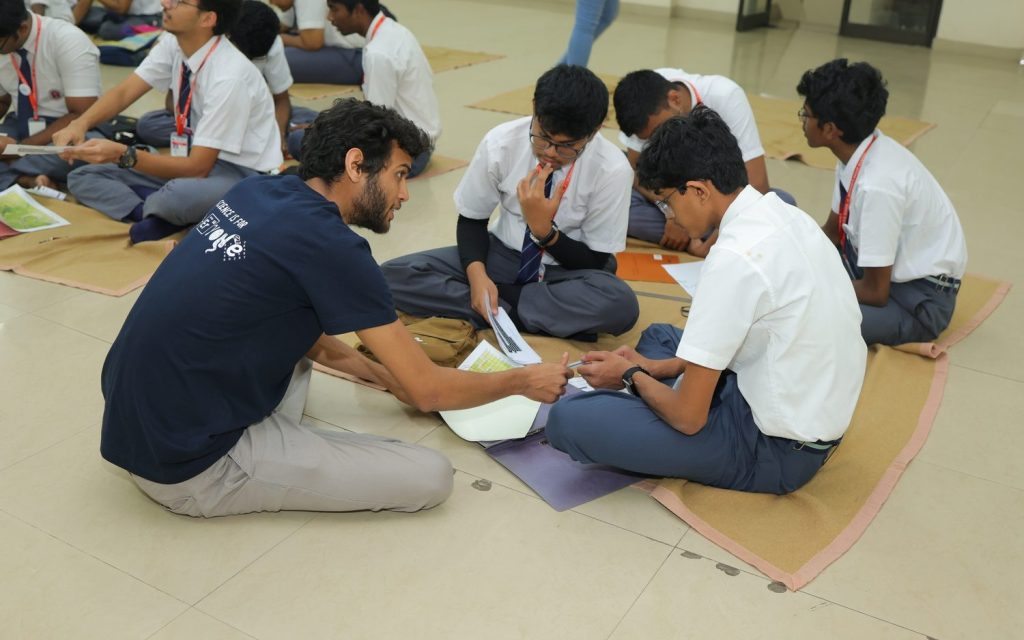
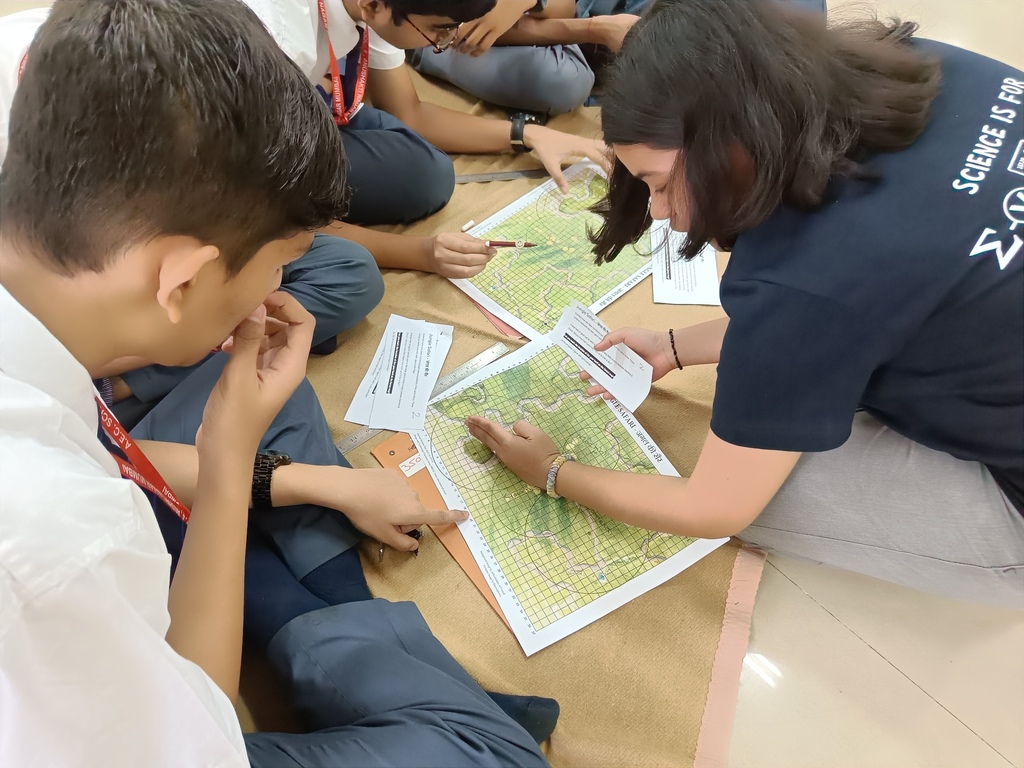
This lesson plan engaged students in school-level mathematics (coordinate geometry, basic calculation, using mathematical tools, etc) mapping and directions as well as geography using a context of wildlife and nature. Students in grades 8 and above participated in this activity. Students mostly worked in dyads or triads. In this session, students had to measure and calculate territories of wild animals, using a set of prompts given to them.
National Science Day 2023
On February 28, 2023, the Homi Bhabha Centre for Science Education organised an Open Day on the occasion of National Science Day. More than 1600 students and teachers visited the campus. Among the various activities and demonstrations organised by various groups at HBCSE, the Design and Technology Group also held a “Science and Design” workshop for students.

Science and Design Workshop
The activity required students to make a toy that demonstrated an animation that was resulting out of a lever-linkage mechanism. This session involved around 100 students from classes 8 to 11, spread across 3 sessions. Some B.Ed. students also attended the workshop. Students worked in pairs and, at times, in groups of 3. We provided students with a board, pen, cardboard strips, and rivets, which are needed to build a simple lever-linkage mechanism.
Design brief:
Design and make a lever linkage mechanism so that it emulates the (mechanical) animation of a hammer striking a nail (N1, marked on the board given to them). Once this is done, change the linkage mechanism in such a way that the hammer now strikes nail N2 (also marked on the board), which is slightly further away.
This must be achieved by adhering to the following constraints:
Constraints:
- The hammer’s position on the cardboard strip cannot be changed.
- The length of the cardboard strip cannot be changed.
- The complete liver-linkage assembly should be in the same location as in the original case (of striking nail N1).


National Science Day 2022
This February 28, 2022, the Centre celebrated NSD but in a restricted manner so as to take care of covid protocols. Close to 500 students and teachers visited the centre. The D&T education group planned and conducted 3 activities which are briefly described below.
Activity 1: Fact OR Fiction? How do you know?
This session was on media literacy and comprised of two parts. In the first part, students were introduced to two strategies namely Lateral Reading and Click restraint by means of various examples and with the aid of actual internet search by students. These were discussed as a way to critically evaluate online information. The second part required students to create posters which would help in spreading awareness on these two new concepts, to their peers. Two sessions of 1 hour each were conducted accommodating 50 students, who worked in groups of 3-4.


Activity 2: Design a Toolkit
This activity required students to design a toolkit for Rasika, a car mechanic, so that she would not forget or lose her tools at the job site. For this, students worked in groups of 3-5 and came up with innovative drawings of design solutions. They also explained their drawings in a worksheet provided to them.


Activity 3: Eliminate and Create
This was a group activity aimed at building lateral thinking, creativity and team work. Each group comprising of 5-6 students had to erase and draw in turns on a given hand drawn object and eventually come up with a useful new object. This had to be done without verbal and non-verbal communication between group members.


National Science Day 2021 (Jump to 3:45:45 – 4:14:50)
National Science Day 2020
Activity: Designing Flags
This activity involved designing a flag of a fictional country. A flag may be defined as “a piece of cloth, usually rectangular and attached to a pole at one edge, that has a pattern that shows it represents a country or a group, or has a particular meaning” (Cambridge Dictionary). Thus flags are minimalistic and often bear abstract symbols which signify a deeper meaning. For this activity, different design briefs with unique situations and fictitious country descriptions were developed for a range of age groups.
The objective of this activity was to provide participants opportunities to; be creative, transform their ideas into effective and attractive visuals and work collaboratively. Through this activity, we tried to emphasize visual design and abstraction skills among students. The students were given a particular design brief and they had to then generate ideas, visually communicate their design ideas through sketches, and also write about their design choices (such as colour selection, symbols). As visitors during NSD span varied ages, we categorised the design briefs into 3 sections; viz for grades 1 to 4 (6-10 years), for grades 5 to 9 (11- 15 years) and for grade 10 to under/post graduation (15 years and above). Designing a flag can be a challenging activity especially for children as flags are iconic, minimalistic in visual design and often try to communicate a message.
Keeping the constraints in mind, we listed a set of rules and a few design principles specific to the task of designing a flag, which acted as both design constraints and guidelines for the students.
Rules for Flag Designing: You have been given a design brief with information about a fictional country.
Design a flag for that fictional country on the rectangular page provided.
Your flag must be related to the design brief.
You can use only 3 colours or less.
No text is allowed.
Your flag should be simple and be seen from far.
The five ‘flag design’ principles were:
Keep It Simple: The flag should be so simple that a child can draw it from memory.
Meaningful Symbolism: The flag’s images, colors, or patterns should relate to what it symbolizes.
Only 2 or 3 Basic Colors: Limit the number of colors on the flag to three which contrast well and come from the standard color set.
No Lettering or Seals: Never use writing of any kind or an organization’s seal.
Be Distinctive or Be Related: Avoid duplicating other flags, but use similarities to show connections.
Design Briefs: (for class 1 to 4 and for class 5 to 9)
A country inhabited only by insects.
A country inhabited only by plants and trees
A country inhabited only by scientists.
A country inhabited only by aliens.
A country inhabited only by snakes.
A country inhabited by people who can fly.
To add to the complexity of the task for older children, a design constraint was given in addition to the design brief. This was to make the task a bit more challenging for the students and also as an attempt to expose them (not explicitly) to visual techniques to achieve minimalism, abstraction and creative ways of drawing.
The design constraints were: 1) You can use only dots and dashes; 2) You can use only the following shapes: triangle, circle, rectangle, square
So, a group would pick a design brief and a design constraint. This meant, if a group picked up “A country inhabited only by insects” and “You can use only the following shapes: triangle, circle, rectangle, square”, it meant that their flag can only be composed of elements which used the given shapes.
Design Briefs: (for class 10 to UG-PG)
A country inhabited only by insects.
A country inhabited only by plants and trees
A country inhabited only by scientists.
A country inhabited only by aliens.
A country inhabited only by snakes.
A country inhabited by people who can fly.
National Science Day 2019
Activity 1: Mystery Box
The activity of mystery boxes works on the principle of creative thinking. An integral part of the Design Thinking process is defining a meaningful and actionable problem statement, which aids in empathizing with the user and generating ideas. We had selected some professions and objects, made cards and kept them in a ‘Mystery Box’.
Mystery Box 1: Professions [Teacher, Barber, Electrician, Farmer, Dentist, Cook, Sweeper, Gardener, Tailor]
Mystery Box 2: Objects [Toolbox, Gloves, Shoes, Head gear, Glasses]
In this, students had to pick one card from each of the Mystery boxes and they had to design something new by combining the two cards.
Here is a glimpse of some of the interesting entries.
Activity 2: Science Characters
This activity involved collaboratively designing a symbolic character based on the description of a science term. The character design process involves listing of ‘physical’ and ‘unique’ attributes. Getting children to make science characters can be a creative exercise and a good way to elicit their understanding of a particular science concept. For this activity, we had prepared science cards on which name and description of the character to be designed was printed. Students were given one of these cards and were asked to design/sketch their science character.
The terms that we gave to students include:
Red Giant: A ‘red giant’ is a star which is red in colour and huge and is going towards the end of its life. This phase occurs in all stars except the most biggest ones. During this phase, the outer layer of the star starts expanding making the star much bigger than its original size. The surface temperature of a red giant can be as high as 4700 Celsius.
Lymph nodes: These are small bean (or kidney shaped) shaped organs. They play a vital role in our body’s ability to fight off infections. They function as filters, capturing viruses, bacteria and other causes of illnesses before they can infect other parts of our body.
Covalent Bond: A covalent bond is a powerful chemical bond that involves the sharing of electron pairs between atoms. The balance of attractive and repulsive forces between atoms, when they share electrons, is known as covalent bonding.
Chloroplasts: These are small organelles inside the cells of plants and algae. They absorb light to make sugar in a process called photosynthesis. The sugar can be stored in the form of starch.